Posts tonen met het label Visual. Alle posts tonen

vrijdag 2 augustus 2013

Understanding complex problems with causal diagrams.

Some problems are just more complex than others. In some cases multiple causes and effects are re-enforcing or smoothing eachother. Typical tools such as 5why's or fishbone don't offer sufficient support to understand and visualise these problem. In my experience, this is when a causal diagram really helps out. A causal diagram is a graphical tool that enables the visualisation of causal relationships between multiple variables in a causal model.

Here is an example of a causal diagram I once made to understand challenges in a complex SAP development and roll-out program, where milestones were systematically not met. The white circles describe causes and effects, where the arrows indicate how one topic has a causal relationship to another. For example, running many projects in parallel causes competition for scarce resources.


Let's have a closer look at how this works using the above example, starting at the bottom right: running many interrelated projects in parallel is increasing the complexity and dependencies in each of the projects. This increased complexity made it hard to make a reliable overall plan. Furthermore, all these projects were competing for scarce resources. When an issue or delay in a high priority project pulled for more scarce resources than planned, other projects where these people originally were planned to work on, were delayed. As a quick fix, it was as a rule agreed that critical resources would only be allocated shortly in advance and for a short period of time; in other words to allow them to work on where the biggest fires were. Consequently, since nobody knew whether critical resources would be available as planned, the quality and relevance of (short term) planning of projects was getting poorer. Basically, people were thinking: "Why bother investing time in making a serious planning; I never get the people I need for my project anyway." As a result, there was no real commitment for any of the timelines of the projects that were on the table. Also, challenging project managers on not meeting their deadlines, systematically resulted in the answer: "I'm not getting a response or availability (from the critical resources)". Gradually, the local roll-out management stopped challenging their local project managers. So, the incentive for good planning and execution slowly diminished. All in all, this resulted in a self enforcing mechanism of constant project replanning, with deteriorating quality of planning, poor commited project managers and nobody who was really following up on realisation of plans.

It took me a while to understand what was really going on. Mapping the interdependencies in a causal diagram helped in analysing the problems and finally defining the countermeasures.

zaterdag 9 juli 2011

Characteristics of work instructions

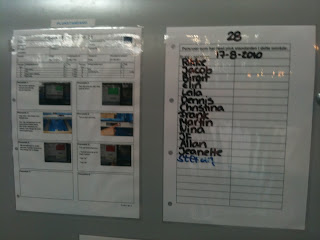
Have a look at these work instructions posted at a work station in the picking area.
What stories about standards does it tell us ?


Here's what I found interesting :
- they are posted at the workstation and visible for all, not filed away in a folder.
- work instructions (left) are supported with pictures
- employees working at the station must sign for accepting the new standards (right)
- work instructions have a limited validity (on the picture 17-8-2010) and must be reviewed by the station owner at fixed intervals.
- should the work instruction be removed, the label above signals the missing document

vrijdag 8 juli 2011

Use problem solving boards to monitor Lean culture

Recently, I visited the Scandinavian Solar subsidiaries and came across an interesting way to monitor the progress of lean culture throughout the company.

Traditionally, the adoption of the Solar Lean Way is measured in the annual employee survey. The survey measures the Lean awareness and employees' belief that the Solar Lean way contributes to serving the customers better and achieving the company's goals. Furthermore the survey includes questions on the lean leadership style of management. These are great measures at the start of a lean journey. However, these measures do not reflect the extend to which improvement activities are taking place throughout the company.

Let me describe how Solar is tracking the amount of continuous improvement activities as a proxy for "lean culture". Incremental improvements or point-kaizens take place on the gemba during meetings at the "lean problem solving boards". Here, teams discuss performance gaps and improvement opportunities on a weekly basis. Performance is measured and compared against goals. Any deviation from target (1) is addressed with rootcause problem finding and/or improvement suggestions (2). As the problem solving progresses (3,4,5), the boards keep track of the number of improvement actions in progress and the number of improvement actions closed (6,7).
( The number between brackets, refer to the numbers on the image below )


On a monthly basis, the number of improvement actions implemented (6) across all departments are aggregated on the regional lean board or country management lean board. Thus, an overview of the overall continuous improvement realisation is made visible and compared to target. On the image below, the red indicates that the continuous improvement goals within a particular location are not met. Hence, they are subject of a problem solving cycle on this board.


I'd love to hear if you have similar or other examples on how continuous improvement culture is tracked.

dinsdag 15 februari 2011

No problem is problem

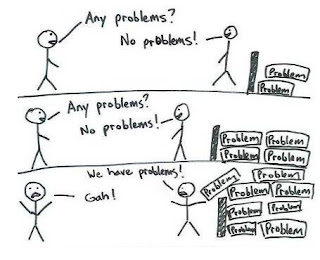
I just love the following image !  It's great for discussing some lean concepts with your team: e.g. the role of the manager, the mental model of "problems are gold", the importance of visualizing problems, the importance of continuous improvement.

Here are some questions to trigger people's thinking:
  1. Why does the person on the right (R) say there is no problem ?
  2. Why does the person on the left (L) accept his 'No problems!' answer ?
  3. Assuming that (L) is the manager, what does he do right ?
  4. What happens after the third image ? What culture and behavior are fostered ?

Here are some possible anwers:
  1. The wall hides (R)'s problems; (R) cannot see his problems. Maybe (R) has learned that it is better to hide problems because e.g. the messenger usually gets shot or gets instructions on what to do about ( i.e. get more work).  Maybe (R) even built that wall for that purpose ?
  2. (L) has no way of verifying that there no problems, as the problems are not visible.
  3. (L) is at the gemba and inviting (R) to talk about his problems. ( Note: Consider asking "What are your problems?" instead of  "Do you have any problems?" The first questions sets the expectation that there always are problems. )
  4. Everybody is firefighting everywhere, everyday.  Consequently, there is less and less time to prevent problems by eliminating root-causes.  The prevailing mindset becomes:  "our hero's are the firefighters" instead of "our hero's are the fire prevention team".
What additional learnings do you find in this picture ?

Source of image : unknown - pls. inform me if you know the author.

dinsdag 8 februari 2011

Why do we need continuous improvement ?


Our business processes are constantly exposed to changes in the environment. These changes impact and deteriorate the effectiveness our company's processes. I like the analogy of a spider web: constant exposure to wind and rain causes filaments to break. (1)

Without continuous improvement.
If our staff is not trained on properly addressing the changes and their impact on our processes, they may not take any action or at best create workarounds to fix the problems (instead of addressing the root causes). Over time, problems and/or workarounds accumulate with increasing complexity and decreasing overall process performance as a result. It becomes more and more likely that another 'improvement project' will be required. Back to the analogy of the spider web: if the spider fails to repair the broken filaments frequently and systematically, big wholes will emerge in the web which render the web useless and leave the spider without food.

With continuous improvement.
Now take the scenario where staff is trained in continuous improvement and supported by their manager to address these problems on a daily basis. First, problems caused by changes in the environment will surface earlier because staff has 'learned to see' problems and is supported by visual management tools (e.g. visual process adherence, visual process performance). Second, the continuous improvement mindset encourages staff to bring up problems. ( cf. mental model "problems are gold" ) Thirdly, staff will address the problems using structured problem solving ( cf. A3 Thinking ). Not only will they identify and fix root causes, but also implement improved standards and monitoring. These problem solving activities can take place during stand-up meetings, quality circles and individual coaching by supervisors. Here's how continuous improvement fits the analogy of the spider: she repairs broken filaments on a daily basis to ensure that the quality of her food collection process is maintained. Last but not least, by implementing a system of continuous improvement, the performance of processes will not just be maintained to but also improved.

A spider repairs broken filaments in her web on a daily basis to ensure the quality of her food collection process is maintained


(1) Source of this analogy: "The Remedy", Pascal Dennis

maandag 7 februari 2011

Four building blocks for driving effective change.

Here's a nice visual representation of four building blocks for driving effective change. I particularly like the description of what happens when one of the building blocks is missing.


Source: unknown

The iceberg of sustainable lean management

Here's a great visual representation of the elements of sustainable lean management.

maandag 31 januari 2011

The Toyota Way - 14 principles in relation


Here's an interesting representation of the 14 principles from The Toyota Way and how they relate to each other.

Source:
http://www.agilecoach.net/wp-content/uploads/2009/05/toyota-way-handout.pdf